

Act on the signal, not the shadow.
One blood test that tracks both tumour cells and tumour DNA at every timepoint, so response, resistance and the next decision are visible between scans.
10,000X
Mean sequencing depth
100+
Clinically relevant genes
3,440+
CpG sites profiled
>99%
Mean on-target coverage
10–12 days
Turnaround from sample receipt
Why it matters
The interval between scans
is where relapse begins.
Between restaging studies, microscopic disease persists and evolves unobserved. By the time it is radiologically measurable, the therapeutic options have narrowed.
20– 30%
Early breast cancer that still becomes metastatic
20–30% of patients with early breast cancer die of metastatic disease ( British Journal of Cancer , 2020).
2 in 3
Solid-tumour deaths involving metastasis
At least two-thirds, on registry data covering 2005–2015 (Cancer Medicine, 2019). The figure often quoted is 90%.
<1 cm
Below the imaging threshold
Imaging, grading and standard serum biomarkers routinely fail to detect micro-metastases.
Why OncoMonitor®
Two biomarkers. One continuous picture.
Measured together at regular intervals, tumour cells and tumour DNA show how the disease is behaving, whether treatment is working, and whether it is coming back — from a simple blood draw.
01
Deep sequencing of tumour DNA, so mixed disease biology is not missed.
02
One report across timepoints , so change is what you read.
03
No tissue biopsy — the same blood draw every time.
Dual biomarkers
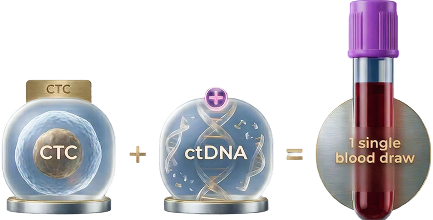
CTC load + ctDNA load, measured from a single blood draw.
The biology
The seeds & the signal.
Cells and DNA describe different halves of the same disease. OncoMonitor® measures both.
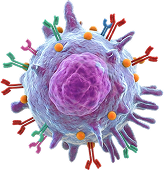
- Circulating Tumor Cells (CTCs)
The concept
The “seeds” of metastasis in distant organs.
Definition
Intact cells shed directly into the bloodstream by the primary tumor.
Significance
Higher counts carry a worse prognosis. They measure how much disease is circulating.
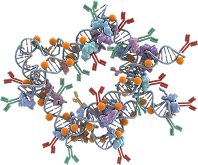
- Circulating Tumor DNA (ctDNA)
The concept
The “signal” carrying specific genomic alterations.
Definition
Fragments of tumour DNA released into the blood.
Significance
Tracks tumour burden over time and names the mutations driving resistance.
How It Works
From one blood draw to a dynamic report.
Three layers of analysis on one sample, in a report that builds with every time point.
STEP 01
Blood draw
A standard blood draw — three tubes in one visit. No tissue biopsy needed.
STEP 02
Isolation
Tumour cells are captured on OncoDiscover®; tumour DNA is extracted from plasma.
STEP 03
Analysis
Cell count, methylation pattern and mutation profile are read from the same sample.
STEP 04
Reporting
Clinical use cases
When should OncoMonitor® be considered?
During therapy
To evaluate the efficacy of neo-adjuvant and adjuvant therapies in different cancers.
Maintenance
Monitoring patients on long-term maintenance therapy.
Small relapse
When relapsed disease is likely to be small (<1 cm) and may be missed on PET scan.
Unclear imaging
When imaging may not differentiate cancer progression from pseudo-progression.
After surgery
To guide adjuvant therapy decisions post curative-intent surgery.
Scans show the shadow; blood carries the signal. See the change before it becomes visible.


Clinical evidence
Recurrence, months before imaging.
Published ctDNA studies across solid tumors report high sensitivity and specificity for relapse, with substantial lead time over radiological surveillance.
Colon cancer
JAMA Oncology
sensitivity
specificity
Average lead time
8.7 months
Breast cancer
Clinical Cancer Research
sensitivity
specificity
Median lead time
8.9 months
Lung cancer
Frontiers in Oncology
sensitivity
specificity
Average lead time
5.4 months
Bladder cancer
Journal of Clinical Oncology
sensitivity
specificity
Average lead time
2.8 months
Clinical synthesis. Across diverse solid tumors, longitudinal ctDNA and CTC tracking consistently identifies recurrence months to nearly a year before standard imaging can visualize the disease.
From detection to action
Guiding adjuvant therapy.
ctDNA-guided management safely reduces unnecessary chemotherapy use in stage II colon cancer without impacting long-term survival.
In DYNAMIC (455 patients, stage II colon cancer), two-year recurrence-free survival was 93.5% under ctDNA-guided management versus 92.4% under standard management — while adjuvant chemotherapy use fell from 28% to 15%.
At five years, recurrence-free and overall survival remained equivalent.
Adjuvant chemotherapy use
Standard
28%
ctDNA-guided
15%
De-escalation for the negative
Untreated ctDNA-negative patients demonstrated a very low risk of recurrence, sparing them from unnecessary toxic treatments.
Targeted aggression for the positive
ctDNA-positive patients derived considerable and measurable benefit from receiving adjuvant systemic treatments.
Real-world proof
Molecular signals,ahead of the scan.
Three patients whose blood signal moved before their scans did.
Lung cancer: relapse seen first in blood
| When | Standard care | OncoMonitor® |
|---|---|---|
| Jan 2024 | Scan shows active disease in the right lung. Chemotherapy begins. | Signal present, with two treatable mutations identified from the same draw. |
| Mar–Apr 2024 | Scans show the disease regressing. | Both markers turn positive — before brain metastasis appears on imaging. |
| Late 2025 | MRI confirms new spread; biopsy confirms the mutations. | Markers had already risen months earlier, and named the emerging resistance mutation. |
Takeaway. At every turn the blood signal moved before the scan did.
Ovarian cancer: following the disease as it changes
| When | Standard care | OncoMonitor® |
|---|---|---|
| Aug 2023 | Surgery for an ovarian tumour; clear cell carcinoma diagnosed. | Baseline signal present, with a BRCA2 mutation identified. |
| Dec 2023 | Nothing seen on imaging. | Tumour DNA has cleared; a single tumour cell is still detectable. |
| Dec 2024 – Feb 2025 | Recurrence confirmed on scan and pathology. | Signal had shifted with the disease, then tracked the response to the new therapy. |
Takeaway. One test followed the disease through recurrence and back into response.
Breast cancer: a clear scan that was not the whole story
| When | Standard care | OncoMonitor® |
|---|---|---|
| After chemotherapy | Surgery finds no remaining disease — a complete response. | Signal still detectable, and rising on the repeat draw. |
| Next time point | Imaging remains clear. | Continued activity prompts a change in adjuvant treatment. |
| On new therapy | Follow-up unchanged. | Both markers become undetectable, consistent with response. |
Takeaway. A complete response on pathology did not mean the disease was gone.
In practice
Ordering, timing, & reading the result.
What to send, when to repeat, and how to read the result.
Sample and timing
Sample
A standard blood draw — three tubes in one visit. No tissue biopsy needed.
Baseline
Draw before a new line of therapy, or three to four weeks after surgery, so later results have something to compare against.
Repeat
At each response assessment, and whenever the clinical picture and the scan disagree. Every result is compared with the last.
Report
10–12 working days.
Interpreting the result
Rising ctDNA or CTC load
Disease activity ahead of, or despite, a stable scan. Supports closer surveillance or a change of course — and often names the mutation behind it.
Falling or undetectable load
Consistent with response or low disease burden. After surgery, supports a conversation about doing less.
Discordance with imaging
A growing lesion with a falling signal is the signature of pseudo- progression. A second read before you change a regimen that may be working.
Reporting
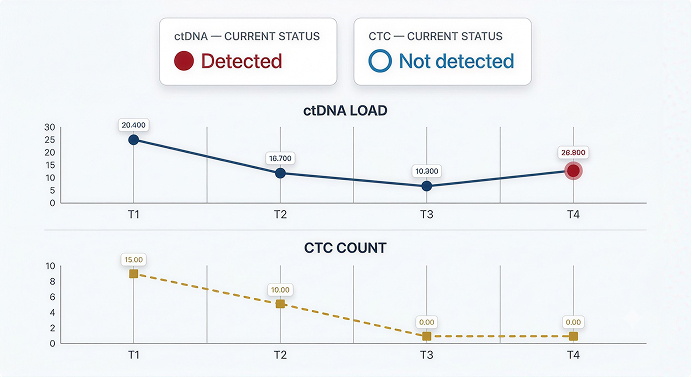
iCARE™ — A report that reads across time.
iCARE™ is the reporting layer, built by oncologists for oncologists. Each result is read against the last rather than in isolation, follows international guidelines, and links every finding to the literature behind it.
Longitudinal monitoring markers
iCARE™
Comparison
How OncoMonitor® compares.
Set against three widely used monitoring and MRD offerings.
| Feature | 1Cell.Ai OncoMonitor® | Competitors |
|---|---|---|
| Turnaround time | 10–12 days | 2–5 weeks |
| CTC enumeration | Yes | Not offered by most |
| ctDNA load | Yes | Yes |
| Gene coverage | 100+ genes | Tumour-informed or up to 100 genes |
| Sample requirement | Liquid only | Tissue + liquid |
Key takeaway. OncoMonitor® is the only platform delivering dual-biomarker profiling, with 100+ gene coverage, from a liquid-only sample, in under two weeks.
Competitor figures are compiled from publicly available test documentation published by each laboratory. Panel contents, turnaround times and methodologies differ between offerings and are subject to change, so figures are not directly equivalent measures of clinical yield.
A 150-year idea
Blood as a window on the tumour.
Reading cancer from blood is not a new idea. What changed is the precision, and the evidence that acting on the signal changes treatment.
1869
Thomas Ashworth sees tumour-like cells in a patient’s blood — the first account of circulating tumour cells.
2022
A randomised trial cuts chemotherapy use from 28% to 15% by following the blood signal ( NEJM ).
1948
Mandel and Métais find free- floating DNA in plasma; its link to cancer follows in the 1970s.
2004
Cell counts shown to predict outcome in metastatic breast cancer ( NEJM ).
2016
First blood-based companion diagnostic approved by the FDA — a single gene.
2020
FDA approves the first broad- panel blood tests for solid tumours.
OncoMonitor® reads both — the cells Ashworth saw and the DNA Mandel described — from one tube, at every timepoint.
For patients and families
What this test means for you.
A blood test your oncologist may order alongside your usual scans, designed to show how your cancer is behaving between them.
What is measured
Cancer sheds two things into the bloodstream: whole tumor cells, and small fragments of tumor DNA. OncoMonitor® measures both, which gives your doctor a fuller picture than either one alone.
What is involved
An ordinary blood draw — three tubes, taken in a single visit. There is no biopsy, no surgery, and no radiation. Results reach your oncologist in 10 to 12 working days.
Why it is repeated
One result is a snapshot. The value comes from the trend — whether the levels are rising, falling, or staying low over months of treatment and follow-up.
Understanding your result
- Not detected
No cancer signal was found above the reference threshold. This is usually consistent with low disease activity or molecular remission. It does not replace your scans, and monitoring continues.
- Detected
A cancer signal was found. This does not necessarily mean the disease has progressed. It gives your oncologist an early prompt to look more closely and, if needed, adjust treatment sooner.
Only your treating oncologist can interpret these results. They are always read alongside your imaging, symptoms, and clinical history.
You do not have to read the report alone.
The test includes genetic counselling built around your individual outcome, so that what the report says — and what it does not say — is clear to you and to your family.
Being monitored closely means changes can be acted on promptly, without waiting for the next scheduled scan.
Ready when you are
Monitor continuously. Intervene early.
One blood draw. Two biomarkers. A report that gets more informative at every time point.
For oncologists
Add a molecular read to your response assessment.
Order OncoMonitor® TRM for advanced and metastatic disease, or MRD for the post-surgical window. Our clinical genomics team can help you place the first timepoint.
For patients and families
Ask your oncologist whether monitoring is right for you.
Request a callback and our team will answer your questions, and connect you with a genetic counsellor once results are available.