
Circulating tumor cell (CTC) profiling of 3,458 epithelial cancer patients using the DCGI-approved OncoDiscover® immunomagnetic capture platform targeting EpCAM antibody
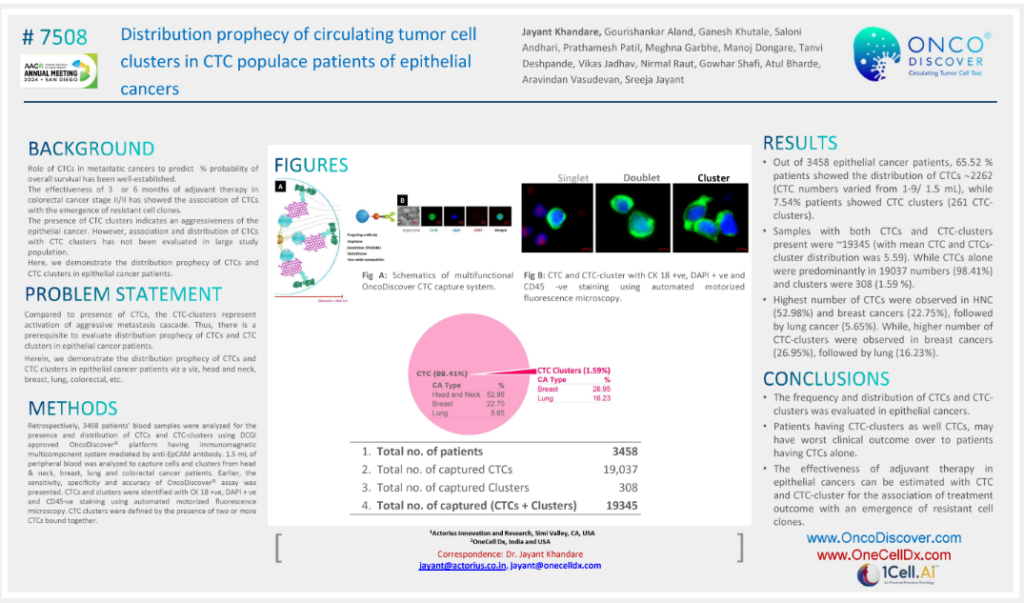
CTC singlets vs. CTC-clusters visualized via fluorescence microscopy with CK18+, DAPI+, and CD45− staining, distinguishing aggressive metastatic cell clusters from single CTCs
Pie chart breakdown shows 98.41% singlet CTCs (n=19,037) vs. 1.59% CTC-clusters (n=308) across the patient cohort
Cancer type distribution of CTCs highest in head and neck cancer (52.98%), followed by breast (22.75%) and lung (5.65%); CTC-clusters highest in breast cancer (26.95%)
Summary statistics table reports 19,345 total captured CTCs and clusters combined, with mean CTC and cluster distribution of 5.59 per sample
CTC-cluster presence linked to aggressive metastasis and potentially worse clinical outcomes compared to patients with CTCs alone, with implications for adjuvant therapy response monitoring